

On this page
The original 14-page PDF explains the same workbook and calculations.
Download the detailed user guide (PDF) ↓On smaller screens, scroll tables sideways to read all columns. With a keyboard, focus a table and use the arrow keys.
What does the calculator do?
The Hostpartner profitability calculator is an Excel workbook for hosts, cohosts and small managers with up to seven properties. Choose the Airbnb fee model, then enter stays, operating expenses and blocked nights to review monthly operating results. The example records show how to fill it in; replace them before using the results for your own properties.
Work through the sheets in this order: START HERE → PROPERTIES → AVAILABILITY → STAYS → EXPENSES → DASHBOARD. Use PROPERTY VIEW for one rental, MONTHLY DATA to trace calculations, and READ & ACT for related explanations.
- Capacity: 7 properties, 400 stays and 400 expenses; formulas use fixed input ranges.
- Analyse one selected year and one currency per working file. There is no currency conversion.
- Inputs are manual. There is no connection to Airbnb, Booking, banks or property management systems.
- This guide follows the supplied .xlsx workbook. Behavior in other spreadsheet applications has not been verified.
How do I replace the example data safely?
Save an untouched original and a separate working copy, for example Hostpartner-2026.xlsx. Edit the gold input cells. Use Clear Contents or paste values into the designated ranges; do not delete entire rows, columns or sheets. The workbook is not protected against accidental formula changes.
Choose the default fee model on START HERE. The common single fee is 15.5%, Airbnb documents 16% for Brazil and Mexico, and other accounts can differ. Select Custom rate when needed. Enter the property list next, then use its dropdown values in STAYS and EXPENSES. Currency on DASHBOARD is calculated from PROPERTIES!E6; do not overwrite it.
| Sheet | Inputs to replace | Keep intact |
|---|---|---|
| PROPERTIES | A6:G12 — replace the property records | H6:H12 checks |
| START HERE | D39 fee model, D40 custom rate and D43 target payout | D41 effective rate and D44 target-price formula |
| STAYS | A6:D405; F:G, I:L and AJ:AK — clear example inputs | E, H and M:AI formulas |
| EXPENSES | A6:F405 — clear example expense inputs | G:I formulas |
| AVAILABILITY | D6:D89 — reset blocked nights to numeric 0, then enter actual blocks | Other columns |
| DASHBOARD | B4 year; E4 month number 1–12 | H4 currency formula and calculated results |
| PROPERTY VIEW | B4 property selection | Calculated results |
How do I set up properties and available nights?
Use PROPERTIES!A6:G12 for up to seven property records. Give every property one unique, stable name. Names are matching keys: changing a name requires updating matching stays and expenses and reselecting the property in PROPERTY VIEW. Keep the property currency consistent with the first property and select a valid Active or Inactive status.
The Active setting controls inclusion for the full selected year. Do not deactivate a property simply to hide it in one month: that can remove its historical activity from the annual view.
Set the year in DASHBOARD!B4. AVAILABILITY contains 84 property-month rows, seven properties × twelve months. In D6:D89, enter whole-number blocked-night counts from 0 up to that month’s calendar-night count. Populated property rows require numeric values; blanks and text are invalid.
Occupancy = occupied nights ÷ available nights. Booked nights remain part of available inventory.
| PROPERTIES field | Input |
|---|---|
| A / Property name | Unique name used to match transactions. |
| B–D / ID, City, Country | Your identifier and location. Matching uses the property name, not the ID. |
| E / Currency | EUR, USD or GBP. Use the same currency as E6 for all properties. |
| F / Included? | Active or Inactive for the full selected year. |
| G / Notes; H / Data check | Optional notes in G. H is calculated: resolve duplicate names or currency/status issues. |
How do I enter each stay?
Use one row per booking in STAYS, rows 6–405. Enter the full stay even if it crosses a month or year. Do not split one reservation into separate monthly records. Check-out is excluded from the occupied-night count: 3 January to 8 January means five nights.
Column H calculates the platform fee from accommodation revenue, cleaning and other host charges. If one reservation uses a different structure or rate, enter that percentage in AK. This is especially useful when a month includes reservations confirmed before and after a fee migration.
| Column | What to enter |
|---|---|
| A / Booking ID | A unique booking reference. Repeated references trigger Duplicate ID. |
| B / Property | A property name selected from the dropdown and listed exactly once in PROPERTIES. |
| C–D / Dates | Actual spreadsheet dates without times. Check-out must be later than check-in. |
| F / Accommodation revenue | Gross accommodation revenue for the whole booking, not the net platform payout. |
| G / Cleaning fee charged | The cleaning amount charged to the guest, separate from your cleaning cost. |
| H / Calculated platform fee | Formula: fee-bearing subtotal × default or reservation-level rate. Do not overwrite. |
| I–K / Booking costs | Actual cleaning, laundry and consumables costs, entered as positive numbers. |
| L / Other variable cost | Other costs belonging to this stay. Do not repeat them in EXPENSES. |
| AJ / Other host charges | Pet, extra-guest or other host-set charges included in the fee-bearing subtotal. |
| AK / Fee-rate override | Optional percentage for this reservation; leave blank to use the START HERE model. |
- E calculates nights; M totals revenue; N totals variable costs; O calculates contribution.
- P calculates booking contribution margin; Q calculates contribution per night.
- R checks the input row; S controls inclusion; T:AI support allocation and overlap checks. Leave these formulas intact.
How does one booking become operating profit?
The first supplied example is MARINA LOFT booking ML-2601-01, from 3 to 8 January 2026. The figures below come from STAYS!A6:Q6 and the January utilities record in EXPENSES. They illustrate the method and are not expected returns.
| Step | Calculation | Result |
|---|---|---|
| Revenue | €850 accommodation + €85 cleaning fee charged | €935 |
| Variable costs | €144.93 platform + €70 cleaning + €30 laundry + €18 consumables | €262.93 |
| Booking contribution | €935 − €262.93 | €672.07 |
| Contribution per night | €672.07 ÷ 5 nights | €134.41 |
| Booking contribution margin | €672.07 ÷ €935 × 100 | 71.9% |
| Other recorded costs | January utilities | €145 |
| Property-month operating profit | €672.07 − €145 | €527.07 |
| Property-month operating margin | €527.07 ÷ €935 × 100 | 56.4% |
How are bookings split across months?
The calculator allocates the full booking’s revenue and variable costs evenly over its occupied nights. This includes cleaning fees and cleaning costs. It does not use the payout date, the invoice date or different nightly prices within a stay.
Illustrative booking: check-in 30 January, check-out 3 February. There are four nights: two in January and two in February. With €800 total revenue and €200 variable costs, each occupied night receives €200 revenue and €50 cost.
| Allocated result | January | February |
|---|---|---|
| Occupied nights | 2 | 2 |
| Revenue | €400 | €400 |
| Variable costs | €100 | €100 |
| Contribution | €300 | €300 |
| Bookings in month | 1 | 1 |
How do I enter recurring expenses without double counting?
Use EXPENSES for property-level operating costs not already recorded against a stay. Rows 6–405 take date, property, category, description, amount and frequency in A:F. Keep the calculated Month, Data check and Included fields in G:I intact.
Choose Utilities, Internet, Insurance, Software, Supplies, Maintenance, Laundry, Rent, Management or Other. Enter a real spreadsheet date, a matching property and a numeric non-negative amount in the workbook currency. Use a description that lets you trace the invoice.
Recurring is a descriptive label, not an instruction to generate future rows. A €40 monthly internet cost requires one dated €40 record for each month incurred. One January row contributes €40 to January only.
Allocate shared costs before entry. For €120 of software shared equally by three properties, enter three €40 rows and keep a note of your allocation rule. If €70 of cleaning is already recorded in STAYS, do not repeat that invoice in EXPENSES.
How do I use the main dashboard?
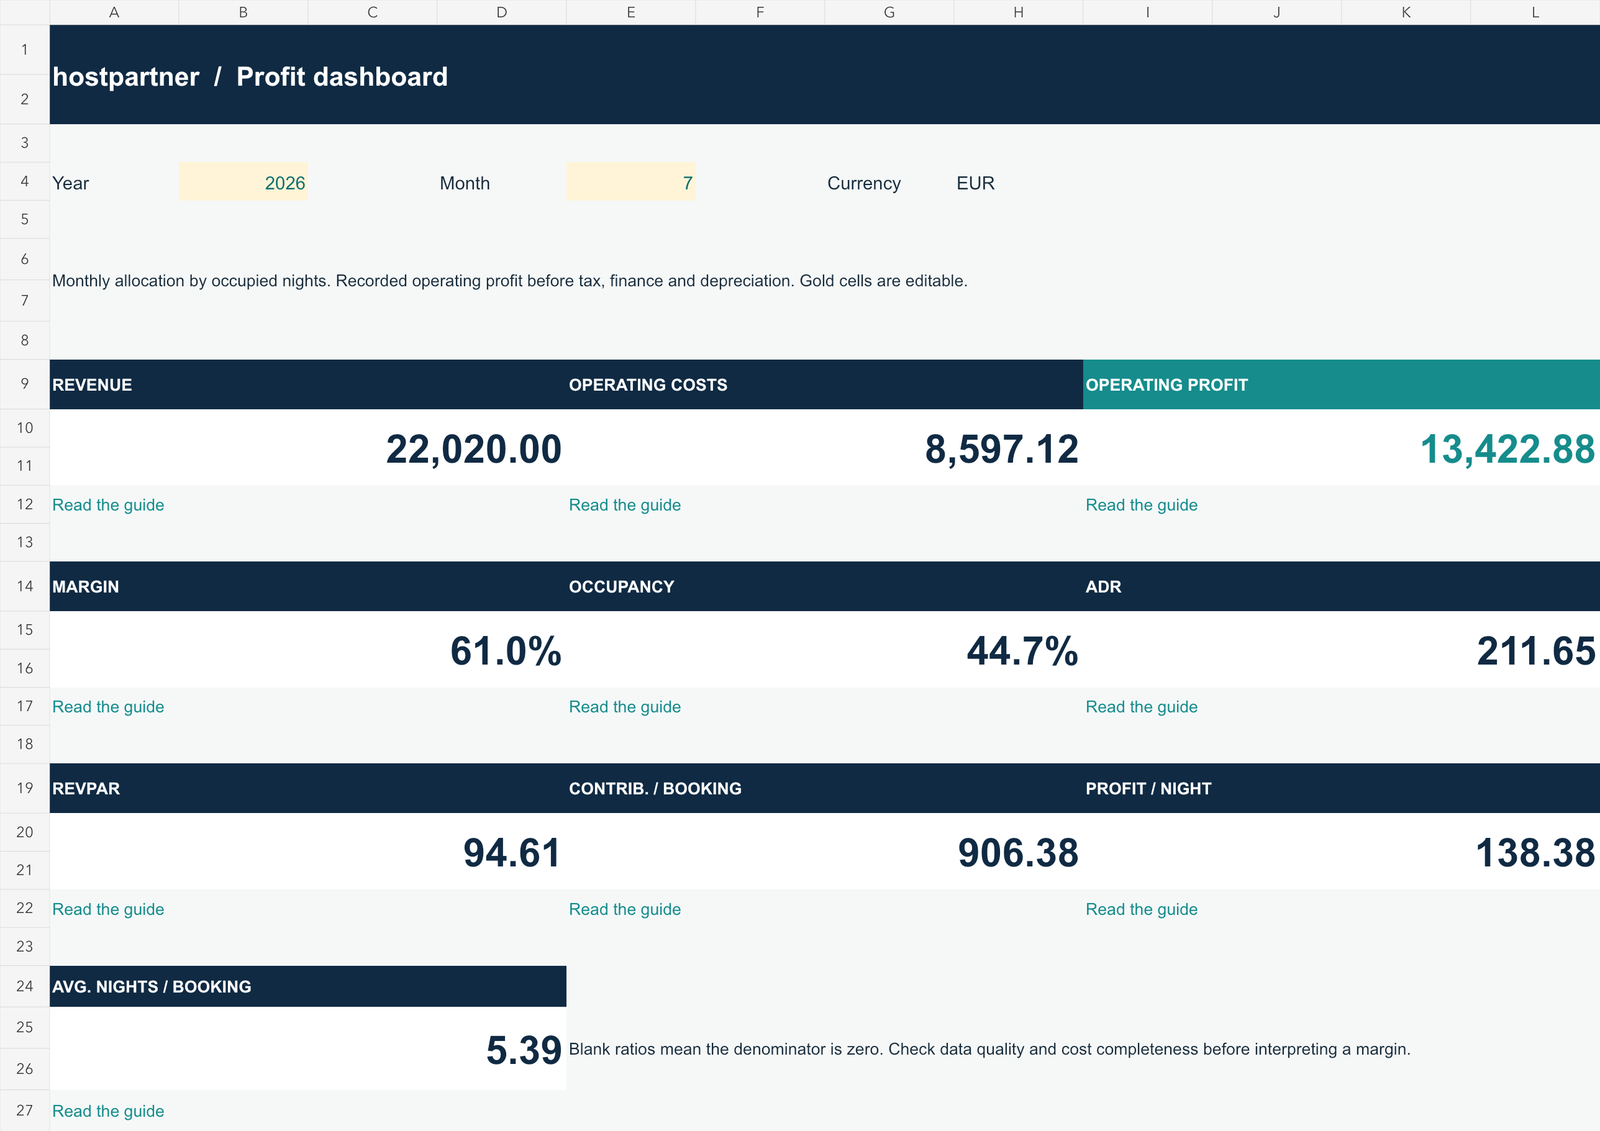
Set the year in B4 and month number in E4. Month 7 shows July, not a year-to-date total. H4 reads the currency from the first property. Start with CHECK BEFORE YOU DECIDE: resolve invalid records and review overlapping stays before interpreting the metrics.
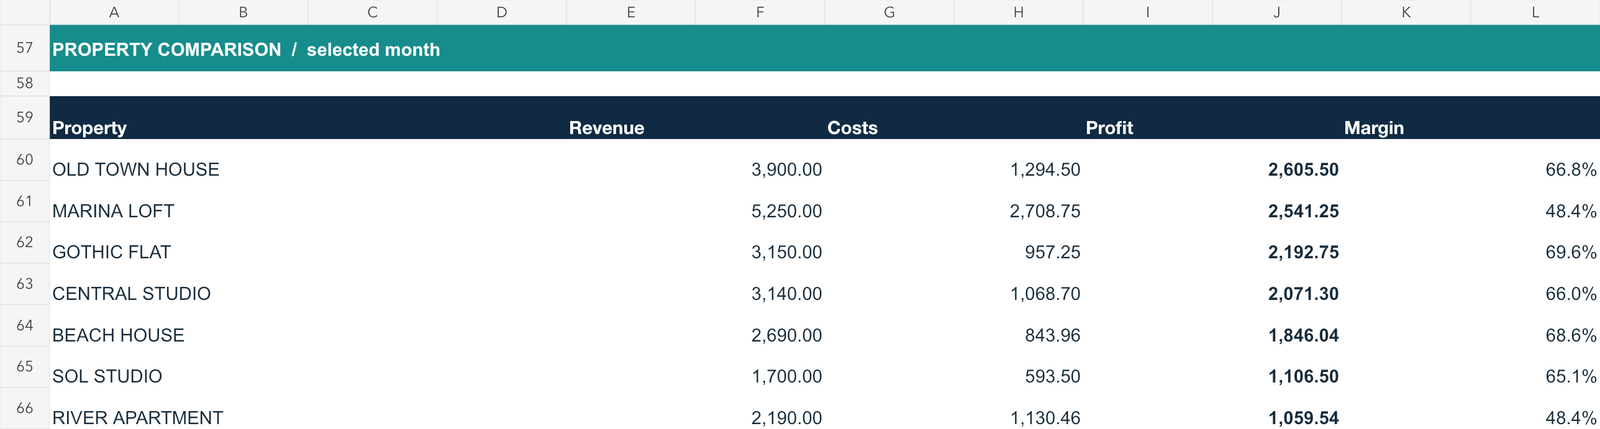
Read revenue, operating costs and operating profit together, then margin and per-night metrics. The year chart shows months in the selected year; the property comparison below the checks uses the selected month. A future month without entered activity is not a forecast.
The supplied July example shows €22,020 revenue, €8,597.12 operating costs and €13,422.88 operating profit. The resulting 61.0% margin reflects only the costs recorded in that example.
What do the ten dashboard metrics mean?
Portfolio ratios use summed amounts, not averages of property percentages. On DASHBOARD and PROPERTY VIEW, a zero denominator produces a blank ratio; MONTHLY DATA can show 0 instead. Inspect the numerator and denominator before interpreting either display. A zero-revenue month can still have an operating loss.
| Metric | Formula and interpretation |
|---|---|
| Revenue | Accommodation revenue + cleaning fees charged, allocated by occupied nights. |
| Operating costs | Allocated variable booking costs + other expenses recorded in the month. |
| Operating profit | Revenue − operating costs. Excludes tax, financing and depreciation. |
| Margin | Operating profit ÷ revenue; multiply by 100 for the percentage. |
| Occupancy | Occupied nights ÷ available nights; multiply by 100 for the percentage. |
| ADR | Accommodation revenue ÷ occupied nights. Excludes cleaning fees charged. |
| RevPAR | Accommodation revenue ÷ available nights. Equals ADR × occupancy as a decimal when scope matches. |
| Contribution per booking | Contribution allocated to the month ÷ bookings with occupied nights in that month. |
| Profit per night | Operating profit ÷ occupied nights. Includes other operating expenses. |
| Average nights per booking | Occupied nights in the month ÷ bookings overlapping that month; not necessarily the full stay length. |
How do I compare properties and trace a result?
Use the dashboard property comparison for the same month, currency and cost coverage. In the July example, MARINA LOFT records €5,250 revenue and €2,541.25 operating profit. OLD TOWN HOUSE records €3,900 revenue and €2,605.50 operating profit. Higher revenue does not identify the stronger operating result.
In PROPERTY VIEW, select a property in B4. Metric cards use the year and month selected on DASHBOARD; the annual chart shows that property’s monthly pattern. Selecting a property does not change the portfolio dashboard’s scope.
MONTHLY DATA has 84 calculated rows, one per property slot and month. A:B identify period and property; C:G show revenue, variable costs, other costs, operating profit and accommodation revenue. H:K show nights, availability, bookings and contribution. L:Q contain ratios. Do not overwrite the formulas.
Recorded revenue − variable booking costs − other costs = operating profit. Inspect source rows in STAYS and EXPENSES if the result surprises you.
Which warnings exclude records and which need review?
Invalid stay and expense rows are excluded. An OK transaction may still be excluded if the property is inactive or invalid; inspect Included in STAYS column S or EXPENSES column I. Overlap warnings do not exclude the affected rows, so both bookings may inflate occupied nights. The dashboard counts affected rows, not unique overlap incidents.
Fixing one issue may reveal another in the same row. An OK check confirms only the implemented rules; it cannot prove all real-world revenue and expenses have been captured.
| Warning or check | Action |
|---|---|
| Missing ID / Duplicate ID | Add a unique booking reference or clear duplicated input cells. Do not split one booking into monthly rows. |
| Unknown or duplicate property | Use the dropdown and correct missing, mismatched or duplicate property names. |
| Invalid dates | Use dates without times; check-out must follow check-in. |
| Check amounts | Use numeric accommodation revenue and numeric non-negative amounts in all populated cost fields. |
| Check currency / status | Match the first property’s currency and select a valid Active/Inactive value. |
| Invalid blocked nights | Enter a whole number from 0 to the calendar-night count for the month. |
| Expense date / property / amount check | Review the date, exact property name, category and non-negative numeric amount. |
| Review overlap | Check whether two valid bookings for one property share occupied dates. Adjacent checkout/check-in dates do not overlap. |
Why does the result look wrong?
| Symptom | Check next |
|---|---|
| Missing stay or expense | Selected period, exact property name, Active status, Data check, Included and rows 6–405. |
| Occupancy above 100% | Overlapping or duplicate stays, blocked-night counts and conflicts between blocked and booked dates. |
| Profit too high | Missing bills, recurring expenses not entered each month, invalid expense rows and excluded properties. |
| Profit too low | Net payouts entered as revenue while fees were also deducted; duplicate cleaning or laundry costs. |
| Results disappear after renaming | Update matching names in PROPERTIES, STAYS and EXPENSES; reselect PROPERTY VIEW. |
| Blank or zero ratio | Inspect its denominator: revenue, occupied nights, available nights or bookings. |
| Stale values or formula errors | Enable calculation and recalculate. Restore overwritten formulas from an untouched original or backup. |
What should I check before closing a month?
Do not average monthly margins to obtain an annual margin. Use total operating profit divided by total revenue for the same included period and properties.
- Complete stays, incurred expenses and blocked nights for active properties. Enter this month’s recurring bills as new rows.
- Resolve invalid inputs and overlaps. Check missing invoices and duplicate expense entries manually.
- Confirm year, month, currency and property scope. Review revenue, costs and operating profit together.
- Inspect margin, occupancy, ADR, RevPAR and per-booking or per-night results. Compare properties with the same cost coverage.
- Trace unusual results in PROPERTY VIEW and MONTHLY DATA. Record an observation, evidence and next action in your own review log.
- Save a dated month-end backup and retain the supporting booking and expense records.
How do I start a new analysis year?
Save a separate annual copy before changing DASHBOARD!B4. The availability calendar recalculates to the new year, but blocked-night inputs remain in their existing slots. Reset those values and enter the new year’s actual blocks.
For a clean annual file, start from the untouched original and follow the input-clearing steps above. Add full bookings overlapping the new year, even when arrival was in the previous year. Enter each full booking and its amounts once in that annual file; formulas allocate the nights relevant to the selected year. Enter expenses by their recorded dates.
Preserve old annual files and document changes to property scope. READ & ACT links to ten Hostpartner research articles; those links require internet access and the article text does not update automatically inside the workbook.
Put the method into practice.
Get the Excel calculator with filled-in examples, then use this guide to prepare your own working copy.
Get my free profitability calculator ↗